Home • Free Resources • Candlestick Patterns
Candlestick Patterns
Engulfing candles, pinbars, dojis, and hammers, reading what a candle's body and wicks are telling you.
Candlestick charts encode more information per bar than a simple line chart, and reading that information correctly is a core technical-analysis skill.
Candle basics
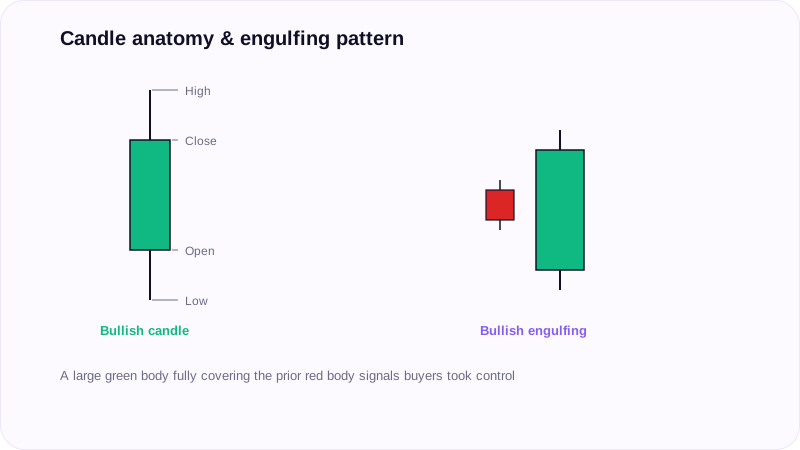
A candle's body shows the open and close for that period; the wicks show the high and low. A bullish (green) candle opens at the bottom of the body and closes at the top. A bearish (red) candle opens at the top of the body and closes at the bottom.
Engulfing pattern
An engulfing candle is one whose body fully covers the prior candle's body. A bullish engulfing candle, a large green candle engulfing a smaller red one, signals buyers took majority control. A bearish engulfing candle, a large red candle engulfing a smaller green one, signals sellers took control and possible weakness ahead.
Pinbar (reversal) pattern
A pinbar shows a sharp rejection wick that signals potential trend weakness. A bullish pinbar has a long lower wick, showing price was rejected at the lows, a possible reversal up. A bearish pinbar has a long upper wick, showing price was rejected at the highs, a possible reversal down. Multi-candle versions of the same idea include three white soldiers (seller exhaustion, more upside expected) and three black crows (buyer exhaustion, more downside expected).
Doji
A doji closes at or very near its open. It often signals an impending reversal, and the longer the timeframe it appears on, the longer the resulting reversal tends to run. A long-legged doji shows strong rejection from the highs or lows right before a reversal.
Hammer
A hammer has a short body and a long wick, signaling a possible bullish reversal. A standard hammer has a long wick at the bottom, showing rejection of the lows. An inverted hammer has a long wick at the top and is still a bullish-reversal signal when it forms in a downtrend.
Don't trade patterns in isolation
Candlestick patterns work best combined with support and resistance, trendlines, or moving averages, not traded alone.
Key takeaways
- A candle's body shows open/close; its wicks show the high/low.
- Engulfing candles signal a shift in control between buyers and sellers.
- Pinbars show sharp rejection at a high or low and can flag a reversal.
- A doji signals hesitation, with reversal significance scaling with timeframe.
- A hammer or inverted hammer signals a possible bullish reversal depending on wick position and trend context.
- Combine candlestick signals with other confirmation rather than trading them alone.