Home • Free Resources • Chart Patterns (Head & Shoulders, Flags, Wedges)
Chart Patterns (Head & Shoulders, Flags, Wedges)
Recurring price structures that describe how a trend is likely to continue or reverse.
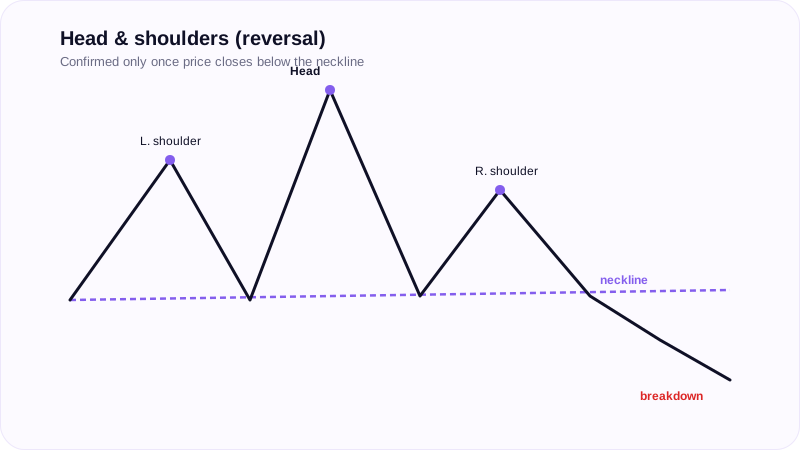
Chart patterns are recurring price structures that describe how a trend is likely to continue or reverse.
Head and shoulders
Head and shoulders is a reversal structure, a high (the first shoulder), a higher high (the head), then a lower high (the second shoulder), in that order. A true pattern has a shared support level, the "neckline", running under both shoulders, and it is only confirmed once the prior trend actually flips after the pattern completes.
Bull flag
A bull flag is a continuation structure, a sharp move (the "flagpole") followed by a retracement or consolidation (the "flag"). It resolves with a breakout continuing the original trend direction, the breakout itself should be judged with the same true/false breakout test used for support and resistance.
Rising and falling wedges
Wedges are converging trendlines, higher lows and lower highs, or the inverse, signaling decreasing volume and momentum in the current direction. A rising wedge signals a likely bearish reversal. A falling wedge signals a likely bullish reversal.
Related concepts
Head and shoulders and wedges are reversal setups. Bull flags resolve via breakout, so applying a true-vs-false breakout test before trusting the continuation matters.
Key takeaways
- Head and shoulders is a reversal pattern confirmed by a neckline break and an actual trend flip.
- A bull flag is a continuation pattern, flagpole, then consolidation, then a breakout in the original direction.
- A rising wedge favors a bearish reversal; a falling wedge favors a bullish reversal.
- Judge any pattern's breakout with the same true/false breakout discipline used for support and resistance.