
Home • Free Resources • Fibonacci Retracement
Fibonacci Retracement
Ratio-based pullback zones between a swing low and swing high, and why the 0.618 zone gets the attention.
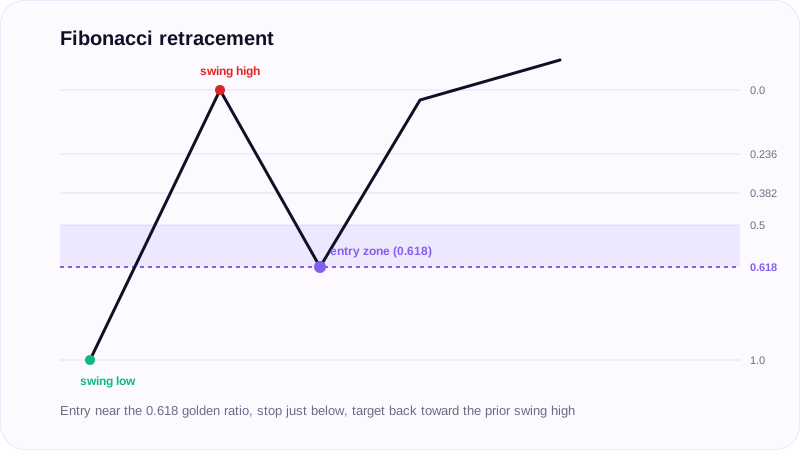
Fibonacci retracement is a tool drawn from a swing low to a swing high, or the reverse for downside setups, marking ratio-based levels where a pullback is likely to find support or resistance before the prior move resumes.
The key zone
The 0.618 retracement, commonly called the golden ratio, is the zone most closely watched. The tool can be drawn on any timeframe, for either upside or downside setups.
Typical usage
A common approach enters at the 61.8% retracement zone, places a stop just below it, and targets the next significant fib level, for example, back toward the 0.382 or 0.236 zone, or the prior swing high.
Related concepts
Fibonacci levels are typically one input among several, trend direction, support and resistance, momentum, rather than a level traded in isolation.
Key takeaways
- Fibonacci retracement marks ratio-based pullback zones between a swing low and swing high.
- The 0.618 (golden ratio) zone is the most closely watched level.
- A common setup enters near 61.8%, stops just below it, and targets the next fib level.
- Treat fib levels as one input into a broader setup, not a standalone signal.