
Home • Free Resources • Moving Averages
Moving Averages
Trend following versus mean reversion, and how a moving average smooths price into a directional read.
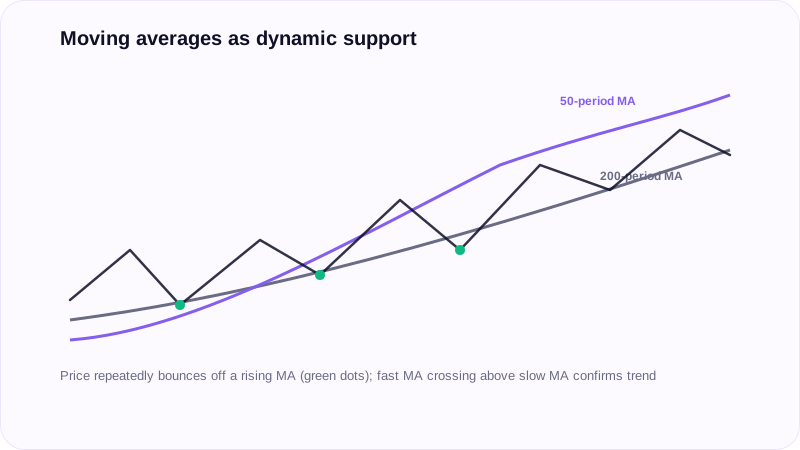
A moving average is an average of price over a defined lookback window, simple, cumulative, or weighted. It is one of the most common tools for reading overall trend direction and for locating dynamic support and resistance.
Two main uses
Moving averages serve two distinct trading purposes. In trend following, price obeys the moving average as dynamic support or resistance, repeatedly bouncing off a rising 200-period moving average, for example. In mean reversion, price behaves like a rubber band stretched around the average, the further price stretches away from it, the stronger the pull back tends to be.
Reading breaks
A break above or below a moving average can signal continued buying or selling pressure in that direction, since the average represents where recent buyers and sellers have transacted on average.
Limitations
Moving averages are not always reliable in isolation, but they remain useful for gauging short-term and long-term directional bias alongside other tools.
Related concepts
MACD is built directly from two exponential moving averages (12-period and 26-period). Moving averages are a standard input into building an overall technical bias alongside other confirmation.
Key takeaways
- A moving average smooths price over a lookback window to reveal trend direction.
- Use it for trend following (price respecting the average as support/resistance) or mean reversion (price snapping back after stretching too far from it).
- A break through a moving average can signal a shift in near-term buying or selling pressure.
- Combine moving averages with other confirmation rather than relying on them alone.